47 Important Instagram Statistics Every Marketer Should Know in 2025

Important Instagram Statistics!
If you’re serious about crushing your Instagram game, you’re probably already keeping tabs on your performance.
But here’s the kicker: your brand’s numbers aren’t enough. To truly dominate the ‘Gram, you need to have a good understanding of Instagram statistics. This will help you know what’s trending, what’s working, and what’s not.
Instagram is constantly throwing new features at us – remember when Reels became the rage or when Stories completely changed the way we engage?
Keeping up with the latest stats is like having a cheat sheet for what’s next.
In this post, we’ll uncover the most important Instagram statistics for 2025. These aren’t just numbers –they’re insights that can sharpen your strategy and help you stay ahead of the curve.
Table of Contents
- 1 Why Are Instagram Statistics Important for Marketers?
- 2 47 Instagram Statistics That Would Help Digital Marketers In 2025
- 3 General Instagram Statistics
- 4 Instagram User Statistics
- 5 Instagram Demographics Statistics
- 6 Instagram Statistics for Business
- 7 Instagram Advertising and Marketing Statistics
- 8 Instagram Engagement Statistics
- 9 Instagram Stories and Reels Statistics
- 10 Instagram Influencer Statistics
- 11 How to Make the Most of These Instagram Stats
- 12 Final Note
- 13 FAQs
Why Are Instagram Statistics Important for Marketers?
Let’s face it – marketing without data is like throwing darts in the dark.
Instagram statistics light up the path, showing you where to aim for maximum impact. They’re more than just numbers; they’re a treasure trove of insights that can help you fine-tune your strategies and connect with your audience like never before.
Let’s break it down. Let’s take a quick look at some of the benefits every marketer will stand to gain from paying a little more attention to Instagram statistics:
Understanding Your Audience
Do you really know your followers? Instagram statistics let you peek behind the curtain, revealing key details like their age, gender, location, and interests. For instance, did you know that 32% of Instagram users are aged 18-24? That’s prime millennial and Gen Z territory.
Take Starbucks’ #RedCupContest as an example. They tapped into their audience’s love for creativity and holiday vibes. And this brought them over 35,000 user-generated posts and massive organic reach.
Knowing your audience lets you craft campaigns that truly resonate.
Optimizing Your Content
What gets more love – photos or videos? Turns out, videos generate 67% more engagement on Instagram.
Imagine this: A fashion brand shares a behind-the-scenes Reel versus a static product photo. Which one do you think would get more clicks and comments?
Instagram stats help you spot these patterns, so you can double down on what works. If your audience is vibing with Reels, create more of them. It’s that simple.
Fine-Tuning Your Marketing Strategy
Ever notice how some posts just hit differently at certain times? If your data shows peak engagement happens between 9 AM and 4 PM on Wednesdays, why not schedule your best posts then?
Instagram statistics aren’t just about what works – they’re about when and why it works.
By analyzing performance trends, you can adapt your strategy to stay ahead in the ever-changing social media game.
Smarter Budget Allocation
Of course, it will be great to know exactly where to put your marketing dollars! Stats like “product tagging boosts sales by 37%” make that decision easier.
Kulfi Beauty, for instance, uses shoppable posts to drive direct sales, freeing up budget for influencer collaborations that amplify reach.
Improving ROI
Here’s the bottom line: Better insights equal better returns. By targeting your ads based on audience demographics and engagement times, you can stretch your budget further and maximize your return on ad spend.
With 44% of users shopping on Instagram weekly, the potential for conversions is enormous.
In short, Instagram statistics aren’t just data – they’re your secret weapon for smarter, more impactful marketing.
Are you ready to level up? Let’s see some Instagram stats that could give you an amazing head start in the coming year.
47 Instagram Statistics That Would Help Digital Marketers In 2025
General Instagram Statistics
Instagram’s influence is undeniable – it’s a powerhouse on the global stage.
Here are some eye-opening Instagram statis to help you understand just how massive (and impactful) this platform is:
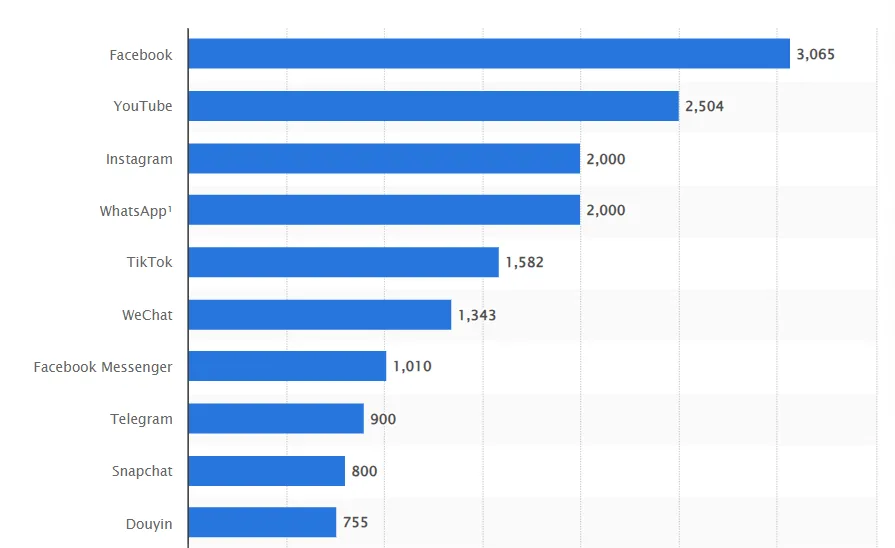
#1: Instagram is the World’s Third Most-Used Social Platform (Tied with WhatsApp)
With a staggering 2 billion active users worldwide, Instagram shares the third spot with WhatsApp as of April 2025.
Leading the pack is Facebook, with a jaw-dropping 3 billion monthly active users. It’s a family affair for Meta, dominating the social space.
#2: The 4th Most-Visited Website Globally
As of July 2025, Instagram.com ranks as the fourth most-visited website in the world, trailing only behind digital giants Google, YouTube, and Facebook. If you’re looking for a space where billions of eyes roam daily, Instagram is it.
#3: The Cultural Trendsetter
Think Instagram’s just for selfies and sunsets? Think again.
According to a survey of over 13,000 internet users aged 16 to 64, Instagram has the most influence on cultural trends. If you’re hoping to kickstart the next viral moment or track what’s trending in your industry, Instagram is your golden ticket.
#4: The Most-Followed Account Belongs to… Instagram Itself!
The platform’s own account, @Instagram, takes the crown with an astronomical 672 million followers. Close behind are football legends Cristiano Ronaldo (628M) and Lionel Messi (502M), with Selena Gomez (429M) and Kylie Jenner (400M) rounding out the list.
#5: Average Engagement Rates by Industry
Engagement is the lifeblood of Instagram, and the average post engagement rate falls between 1.44% and 2.31%, depending on the industry.
- Real estate: 1.44%
- Retail: 1.62%
- Government: 2.31% (the highest!)
#6: AI Now Drives More Than Half of Instagram’s Content Recommendations
2025 marked a tipping point: users now see more AI-recommended content than posts from accounts they follow. This makes understanding Instagram’s algorithm critical to getting your content in front of the right audience.
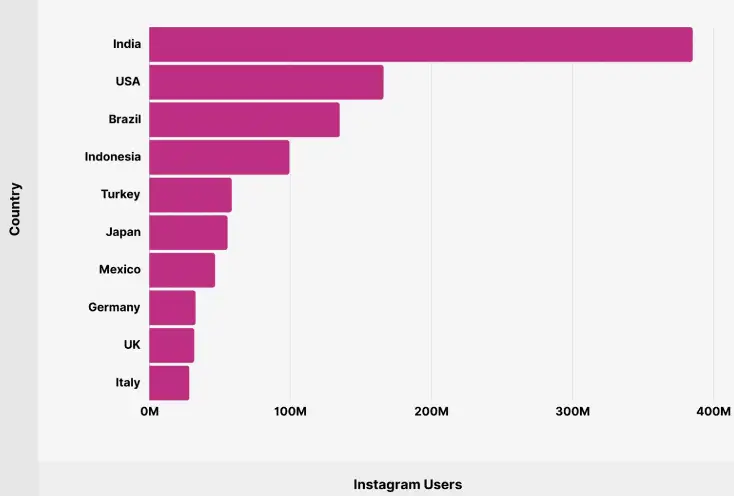
#7: There Are 169 Million Instagram Users in the United States
With 169 million users in the U.S., Instagram is the second-largest platform in the country. India takes the lead with a whopping 360 million users, followed by Brazil at 134 million.
This global appeal makes Instagram an exceptional platform for brands looking to expand internationally.
Instagram User Statistics
Instagram isn’t just popular – it’s a way of life for billions around the globe. Now, let’s consider some fascinating Instagram statistics about its users and their behaviors:
#8: Almost Every Instagram User Uses the App Alongside Other Platforms
Only 0.2% of Instagram users stick solely to the app, according to data from Kepios.
Instead, the majority pair it with platforms like Facebook (80.8%), YouTube (77.4%), and TikTok (52.8%). For marketers, this highlights the importance of crafting a cross-platform strategy to stay connected with your audience everywhere they scroll.
#9: Entertainment is the Main Attraction
Instagram isn’t just about pretty pictures anymore. 64.8% of users come to the platform for entertainment, seeking funny or engaging content.
If you want to capture attention, it’s time to get creative with reels, memes, and interactive posts that make your audience laugh or think.
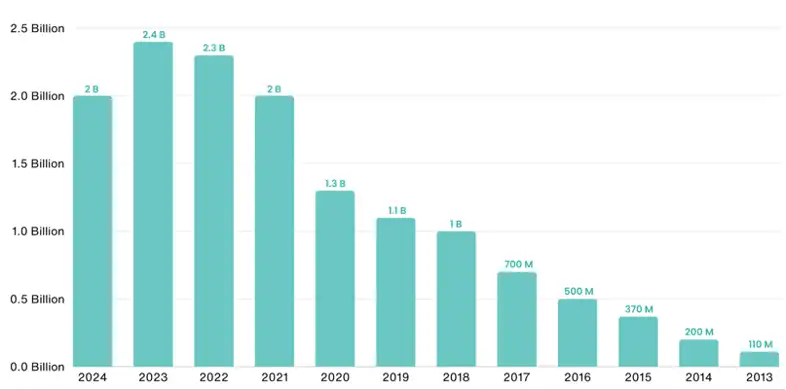
#10: Instagram Has 2 Billion Monthly Active Users
Yes, you read that right – 2 billion people use Instagram every month. While Facebook may still reign supreme, Instagram offers a vast pool of potential followers, customers, and fans waiting to engage with your brand.
#11: U.S. Adults Spend 33 Minutes a Day on Instagram
With platforms like YouTube and TikTok dominating video content, Instagram still holds its ground. U.S. adults spend 33.1 minutes daily on Instagram, up three minutes from the previous year. That’s ample time to grab attention with compelling posts or videos.
#12: Teenagers are Loyal Instagram Fans
Nearly 47% of U.S. teens hop onto Instagram at least once a day, with 8% checking their profiles “almost constantly” and 37% visiting multiple times daily. If your target audience skews younger, this is a key demographic you can’t afford to ignore.
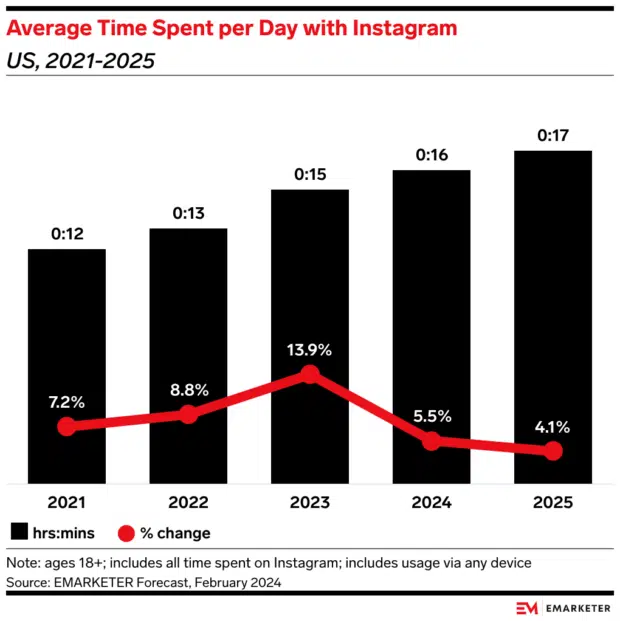
#13: Time Spent on Instagram Will Keep Growing
By 2025, U.S. users will spend an average of 17 minutes a day on Instagram, a slight increase from previous years. While growth has slowed, this still presents valuable opportunities for brands to capture their audience’s time and attention.
Source: eMarketer
#14: Instagram is Becoming a Search Tool
Here’s a surprising stat: 36% of users now use Instagram as a search engine. Whether it’s finding trends, products, or inspiration, people are relying on Instagram much like Google. This means Instagram SEO is more crucial than ever for discoverability.
#15: Instagram Fuels Shopping Searches
While only 7% of U.S. consumers start their online shopping search on Instagram, this is still a significant number of users actively looking to buy. It’s a goldmine for marketers ready to position their products in front of eager shoppers.
Instagram Demographics Statistics
Understanding Instagram’s demographics can help marketers craft strategies that resonate with their target audience. Let’s dive into the key numbers that reveal who’s using the platform and where.
#16: Instagram is a Young Adult Playground
Instagram thrives among younger audiences, with over 60% of its user base aged between 18 and 34. Whether they’re scrolling through reels, sharing stories, or following influencers, young adults and Millennials dominate the platform.
If your brand targets this age group, Instagram is where you want to be. Think trendy, relatable, and visually captivating content to grab their attention!
#17: There Are More Male Than Female Users
Globally, Instagram boasts a nearly even gender split, with 51.8% male and 48.2% female users. This balance means the platform doesn’t lean heavily towards one gender, making it a versatile choice for brands targeting diverse audiences.
Whether you’re promoting fashion or tech gadgets, Instagram has space for your campaign.
#18: India and the U.S. Lead the Pack
India is the heavyweight champion of Instagram users, boasting 385.35 million users – a staggering number that reflects the country’s growing digital footprint.
The United States follows with 166.15 million users, making it a key market for brands looking to tap into tech-savvy consumers.
If you’re planning international campaigns, these numbers highlight the massive potential for growth in these regions.
Instagram Statistics for Business
Instagram is a powerhouse for businesses, offering immense opportunities for growth, engagement, and ROI. If you are on the platform for business purpose, then you should pay serious attention to the stats below:
#19: 68% of Marketers Say Instagram Delivers Positive ROI
Instagram isn’t just about pretty pictures; it’s a revenue driver. 68% of marketers say they are confident the platform delivers positive ROI, ranking second only to LinkedIn.
With marketing budgets under pressure, knowing where your efforts yield the best results is invaluable. Instagram’s ability to connect brands with engaged audiences makes it a strong contender for any marketing strategy.
#20: 70% of Shoppers Look to Instagram for Their Next Purchase
When it comes to shopping inspiration, Instagram reigns supreme. A whopping 70% of shoppers turn to the platform to discover their next purchase.
Whether it’s a trendy outfit or the latest gadget, Instagram helps users make buying decisions, putting your products right where they need to be – on their feeds.
#21: More Than Half of Instagram Users Follow or Research Brands
Did you know that 62.7% of Instagram users actively follow or research brands and products on the app? This makes Instagram the go-to platform for people looking to engage with businesses.
From exploring products to staying updated on the latest launches, Instagram plays a pivotal role in shaping buying decisions.
#22: 86% of Organizations Have a Presence on Instagram
With 86% of organizations active on Instagram, the platform is a competitive yet rewarding space for brands. Whether you’re a small business or a global giant, having a presence here is crucial to stay relevant and connected to your audience.
#23: Average Instagram Posting Frequency Varies by Industry
Posting consistency matters, but how much is too much?
For businesses, posting frequency ranges from 0.35 to 1.25 posts per day, depending on the industry. Entertainment brands top the list, while finance brands post the least.
Knowing where your industry falls on this spectrum can help you strike the right balance.
#24: Instagram Photo Posts See the Highest Engagement at 2.69%
Surprise! Photo posts have overtaken carousels as the most engaging format for business accounts, boasting an engagement rate of 2.69%. Whether it’s a behind-the-scenes snapshot or a product close-up, static images still capture attention and drive interaction.
#25: Fashion Brands Dominate Searches on Instagram
When it comes to user searches, fashion brands lead the pack, accounting for 12% of searches. Hair and makeup follow at 11%, with interior design at 10%.
This highlights the platform’s strength in visually driven industries and its ability to connect users with brands that spark creativity and style.
Instagram Advertising and Marketing Statistics
Instagram continues to be a top choice for marketers looking to maximize their advertising ROI. With consistent growth in reach, revenue, and engagement, here’s why advertising on Instagram should be a key part of your 2025 marketing strategy:
#26: Instagram Ad Reach is Growing
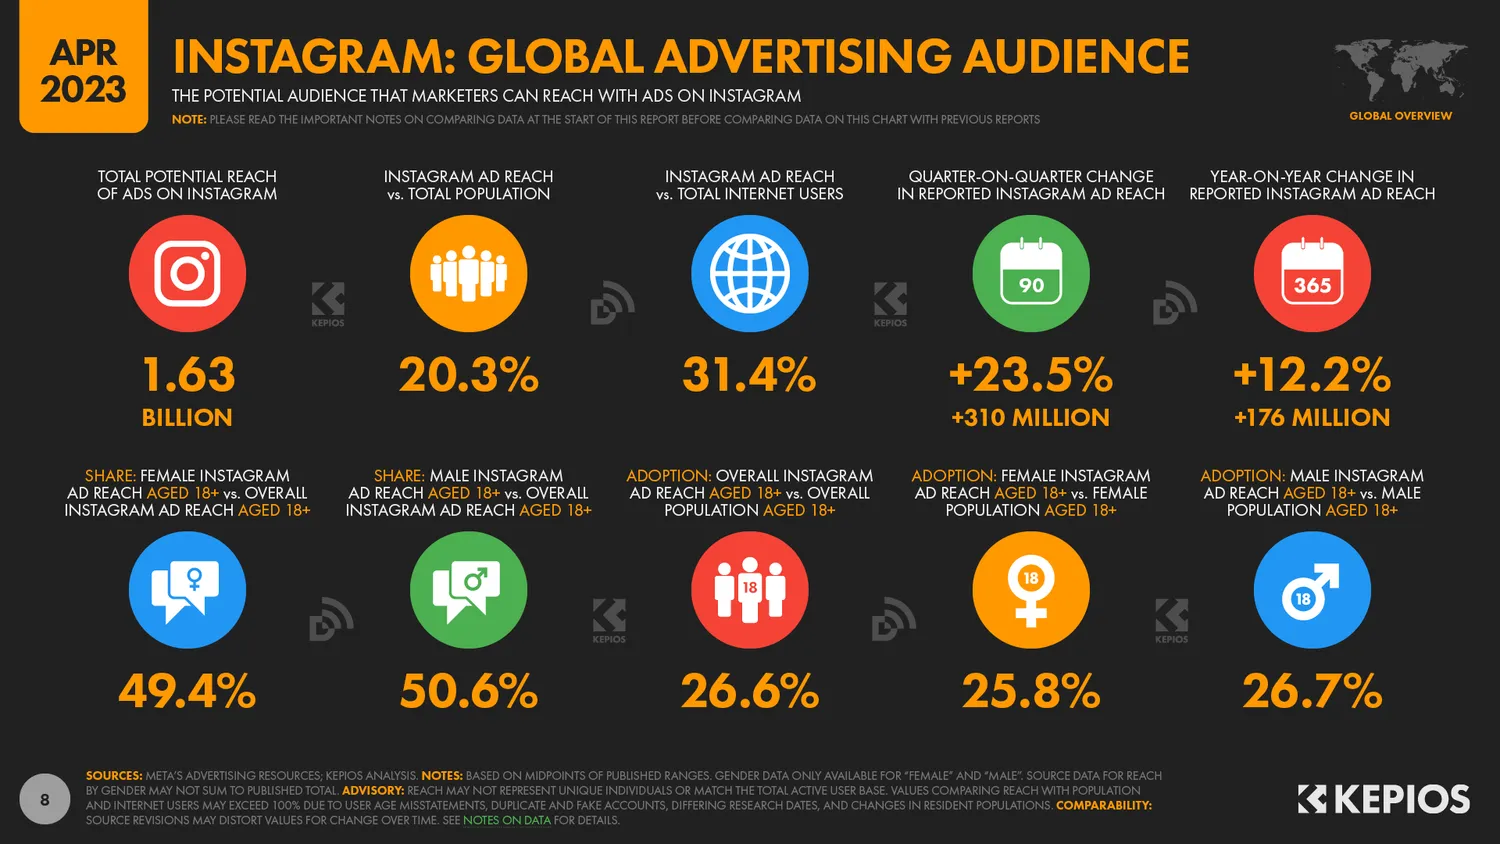
With a 12.2% year-over-year increase in ad reach, Instagram’s expanding user base makes it a prime platform for reaching more eyes and delivering impactful campaigns. Whether you’re building brand awareness or driving conversions, the numbers speak for themselves.
#27: Instagram Ads Account for 9.8% of All U.S. Digital Ad Spend
In 2025, Instagram secured nearly 10% of total U.S. digital ad spend. This impressive share reflects marketers’ trust in the platform’s ability to deliver results.
As Instagram’s popularity grows, its share of ad budgets is only set to increase.
#28: In-Feed Ads Drive the Majority of Revenue
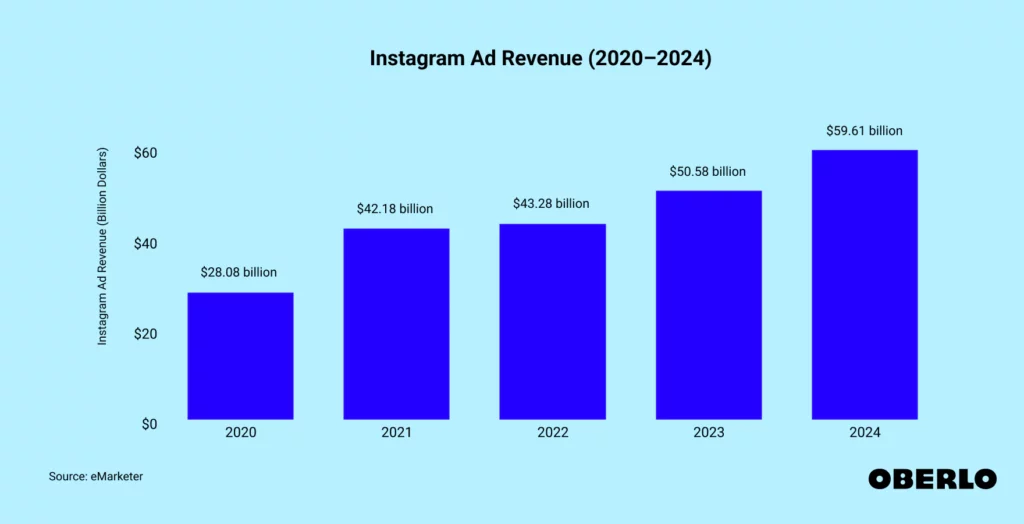
Instagram’s ad revenue reached a whopping $50.58 billion in 2025, with in-feed ads leading the way. Stories ads accounted for 26.7% of the total ad revenue, but in-feed placements still dominate, thanks to their strong performance metrics.
#29: Feed Ads Have a Higher Click-Through Rate (CTR) Than Stories Ads
When it comes to click-through rates, feed ads range between 0.22% and 0.88%, outperforming Stories ads, which range from 0.33% to 0.54%.
While both formats have their merits, feed ads consistently drive more clicks, making them a staple for brands seeking higher engagement.
#30: Average Cost-Per-Click (CPC) is Budget-Friendly
Instagram ads are competitively priced, with CPC ranging from $0.00 to $0.25, according to WebFX. Impressions are slightly higher, averaging $0.00 to $4.00 CPM.
Meanwhile, cost-per-engagement (CPE) falls between $0.03 and $0.08, making Instagram a cost-effective choice for ads.
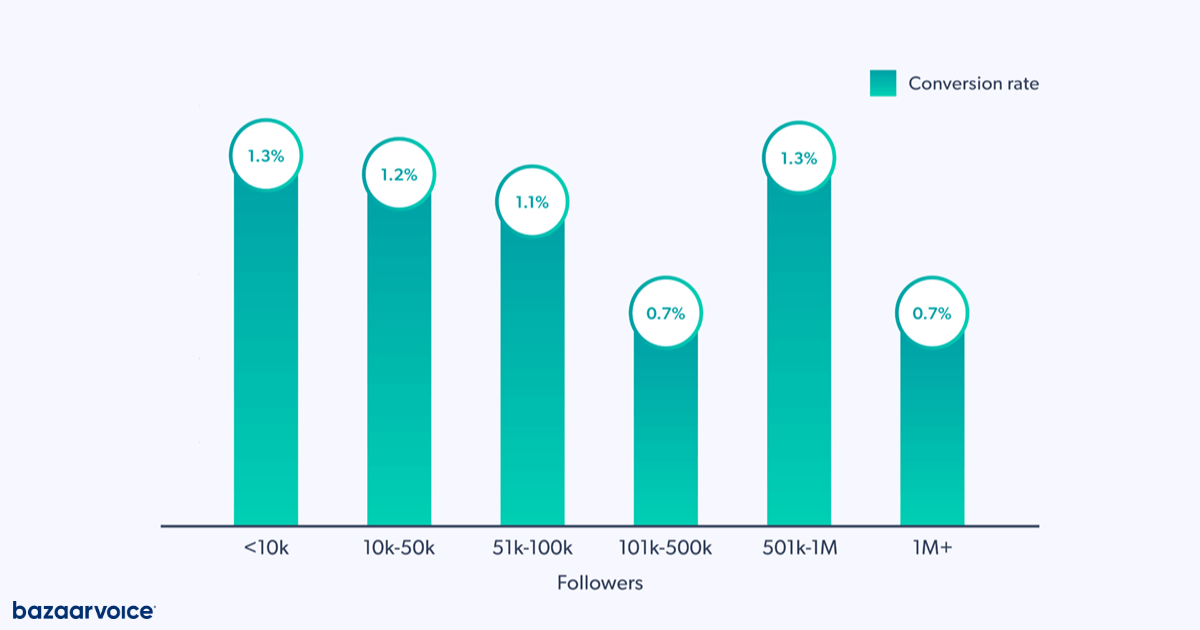
#31: Brands See an Average Conversion Rate of 1%
On Instagram, the average conversion rate for top-performing brands is 1%, but smaller accounts still dominate the conversion game.
Brands with fewer than 10k followers boast the highest conversion rate of 1.3%, while accounts with up to 100k followers saw a rise from 0.3% to 1.1% compared to last year.
Instagram Engagement Statistics
#32: Engagement Continues to Grow Across Key Metrics
In 2025, the average Instagram post received 15.66 comments, 513.37 likes, and 19.79 saves.
This marks an increase in comments from the previous year, highlighting the growing trend of interactive content. While saves slightly dipped from 20.28 in 2025 to 19.79 in 2025, they still remain a key indicator of valuable content.
#33: Carousels Outperform Image Posts in Reach
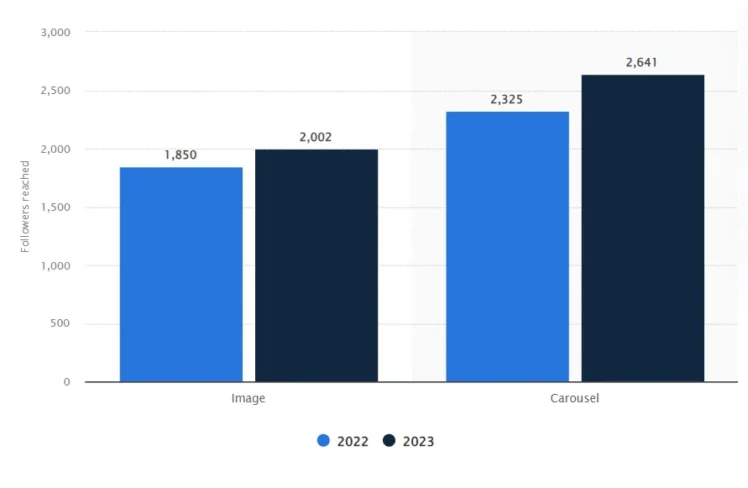
Carousels, with multiple images or videos in a single post, reached an average of 2,641 users, significantly outperforming single image posts, which averaged 2,002 users.
This shows that audiences are more likely to engage with posts that offer diverse, swipeable content.
#34: Higher Education Tops Engagement Rates Across Industries
The average engagement rate across all industries on Instagram is 0.43%, but higher education soars ahead with a remarkable 2.43% engagement rate. This underscores the importance of tailored content strategies for specific industries.
#35: Video Content Dominates Attention
Instagram users have increased their time spent watching videos on the platform by 80%. If you’re not already incorporating video into your strategy, now is the time to get on board.
Short-form videos like Reels are especially powerful for capturing and holding attention.
#36: Hashtags Are Still Relevant
The best-performing posts on Instagram use an average of 5.44 hashtags. This statistic proves that hashtags remain a vital tool for boosting discoverability and expanding reach.
#37: Photos With Faces See Higher Engagement
Posts featuring faces outperform those without by 38%. Whether it’s candid shots, selfies, or customer testimonials, showcasing faces fosters a sense of connection and relatability, making these posts more engaging for viewers.
Instagram Stories and Reels Statistics
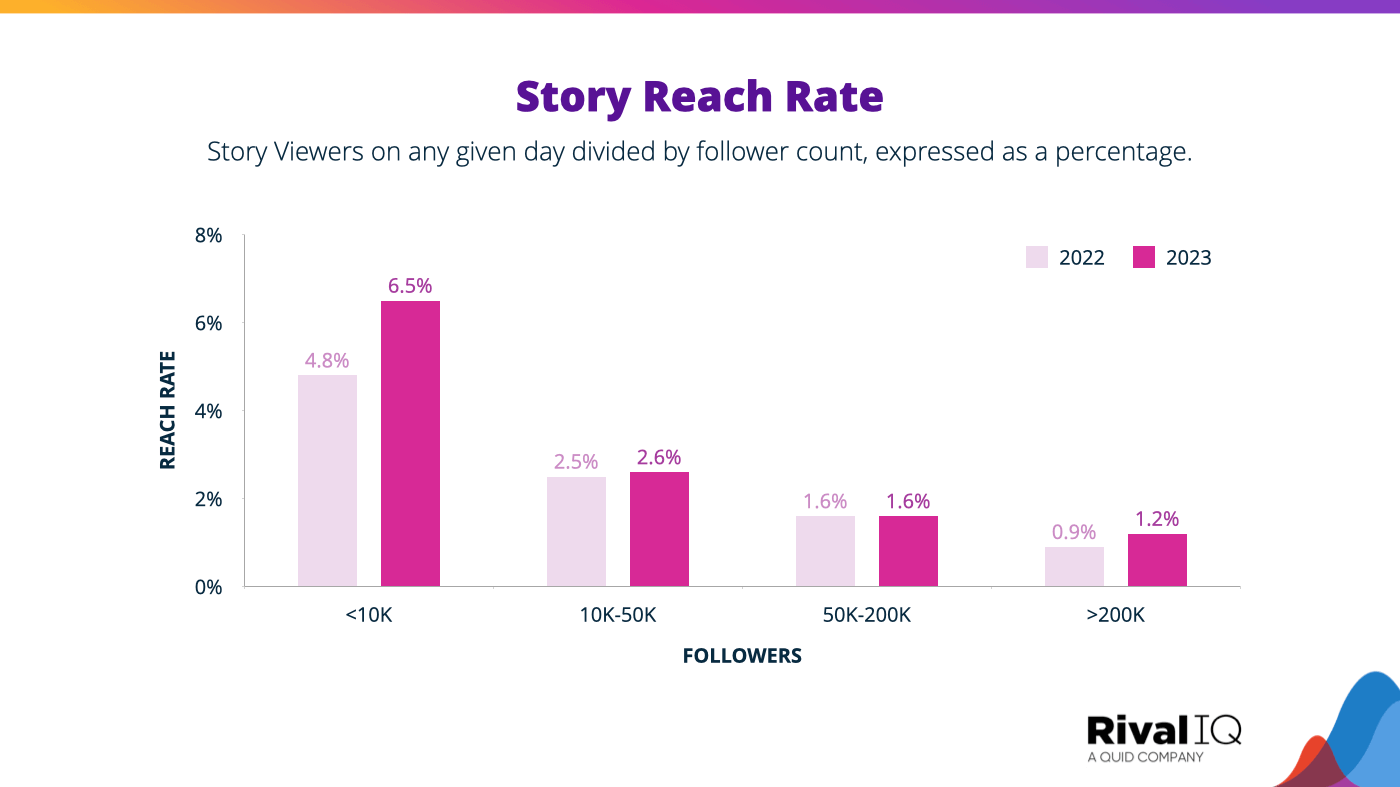
#38: Story Reach Rate is Rising Again
After experiencing a decline in recent years, the reach rate for Instagram Stories is showing signs of recovery.
Smaller brands, particularly those with under 10k followers, have seen the most significant boost, with a 35% increase in reach rate.
While mid-sized brands’ reach rates have stagnated, this is an encouraging trend for smaller businesses leveraging Stories to connect with their audience.
#39: Reels Dominate Time Spent on Instagram
Reels now account for more than half of the time people spend on Instagram. This means that having a well-thought-out Reels strategy is essential for reaching and engaging your audience.
Beyond just engagement, Reels are a gateway to reaching new audiences through Instagram’s recommendation algorithms.
#40: Reels Engagement is Declining but Still Leading
Despite their popularity, engagement rates for Reels have seen a 25% decline over the past year. However, with an average engagement rate of 1.23% per post, Reels continue to outperform other types of Instagram content in driving interaction.
If you’re focused on creating engaging content, Reels should still be a key part of your strategy.
#41: Short Narrative-Type Stories Capture Attention
When it comes to Stories, short narratives that blend photos, videos, and text are the most preferred by 35% of consumers.
Interactive Stories featuring quizzes and polls are also a hit, providing an excellent way to boost engagement and keep your audience involved.
#42: Reels are Shared at Lightning Speed
A staggering 694,000 Reels are shared via direct message every minute. Meta reports that Reels make up more than half of all content reshared in messages, making them a crucial tool for sparking conversations and expanding reach.
#43: Keep Reels Short for Maximum Reach
If you want your Reels to be recommended to non-followers, keep them under 90 seconds. Instagram’s @creators account suggests the sweet spot for engagement is 30 to 90 seconds.
While longer Reels can work for in-depth content, sticking to this guideline ensures your videos have a higher chance of appearing in recommendations.
Instagram Influencer Statistics
#44: Instagram is the Top Platform for Influencer Marketing
Instagram reigns supreme as the top platform for influencer marketing. A striking 80.8% of marketers plan to use it for their influencer campaigns in 2025.
If you’re venturing into influencer collaborations, Instagram is the ideal starting point for connecting with audiences and amplifying your brand’s reach.
#45: Nano Influencers Make Up the Majority
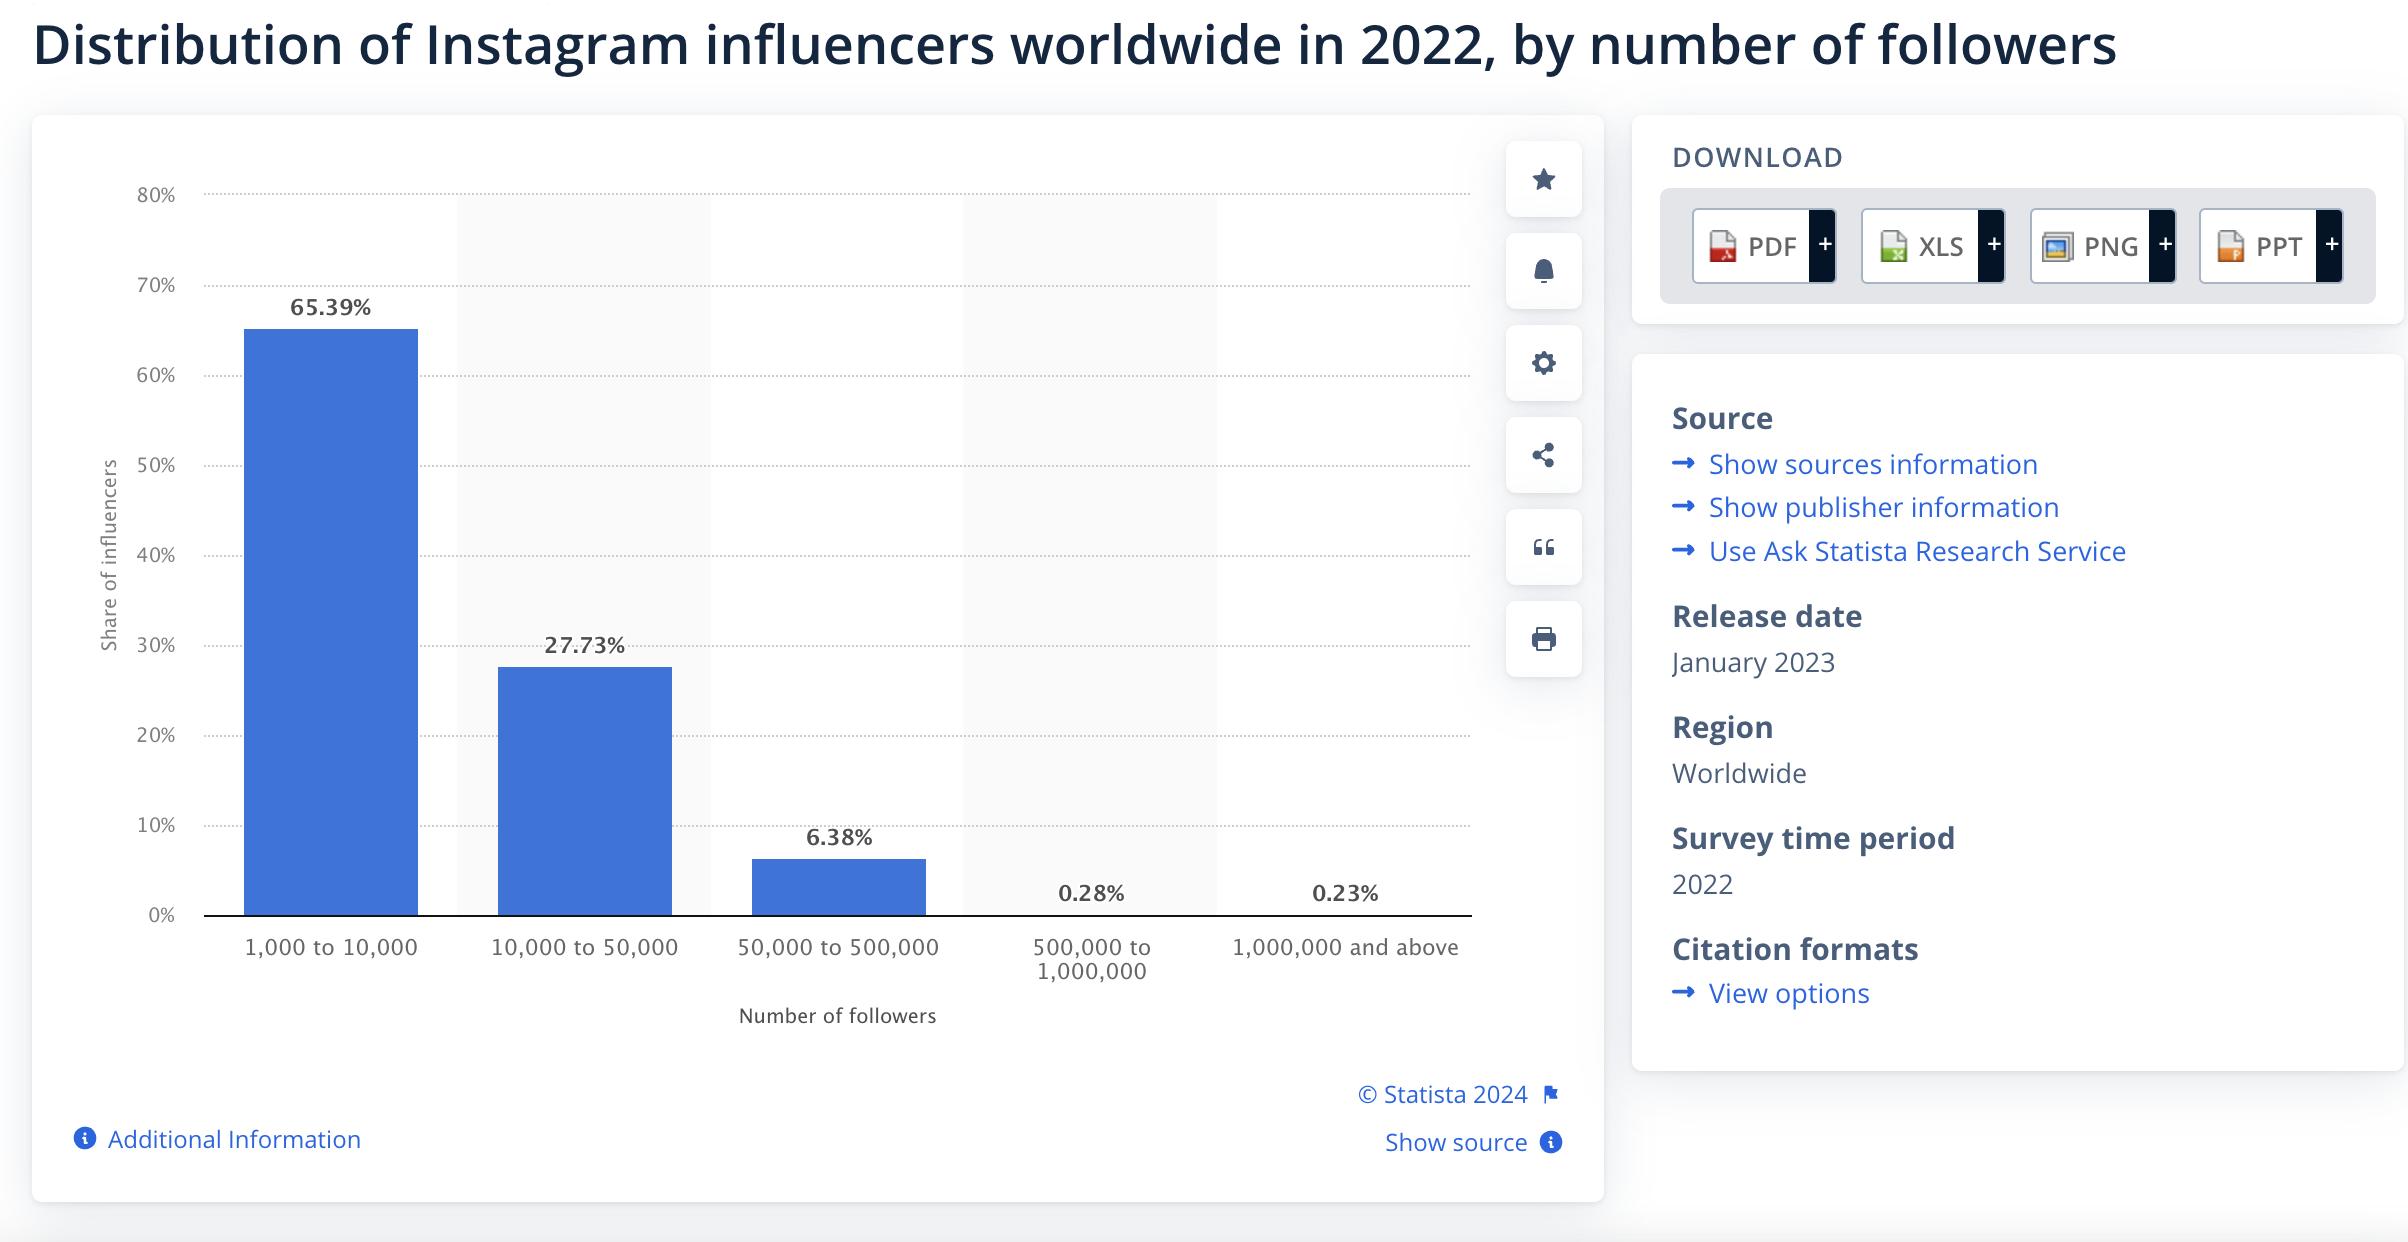
According to Statistia, a whopping 65.39% of Instagram influencers are nano influencers, with follower counts ranging between 1,000 and 10,000, according to Statista.
These creators often have highly engaged and niche audiences, making them a cost-effective choice for brands. Close behind, micro-influencers – those with 10,000 to 50,000 followers – account for 27.73% of influencer accounts.
#46: Engagement Rates for Affiliate Links Hold Steady
Instagram influencers see an average 2.0% engagement rate on affiliate links. While this is lower compared to TikTok’s 5.2% rate, Instagram’s consistency across all influencer tiers is a notable advantage.
Unlike TikTok, where follower count significantly affects engagement, Instagram maintains steady rates, offering brands a reliable channel for affiliate marketing.
#47: Feed Posts Lead Sponsored Content Formats
When it comes to sponsored content, 98.4% of influencers use feed posts, making them the most popular format for promotions.
Stories follow closely with 98.1%, and Reels aren’t far behind at 98.0%. This highlights the importance of using multiple content types to maximize exposure.
For marketers, it’s crucial to clearly define the deliverables across these formats to ensure maximum returns from influencer partnerships.
How to Make the Most of These Instagram Stats
Stay Ahead of the Curve
Instagram evolves rapidly, and sticking to an outdated strategy can leave you playing catch-up. These statistics offer a clear lens into what’s working right now.
For example, Reels have been key to audience growth for some time, but recent stats show that photo posts are making a strong comeback in engagement.
If you’re relying solely on carousels, it might be time to test fresh formats. Use these insights to tweak your strategy and keep your content relevant.
Leverage Instagram Insights
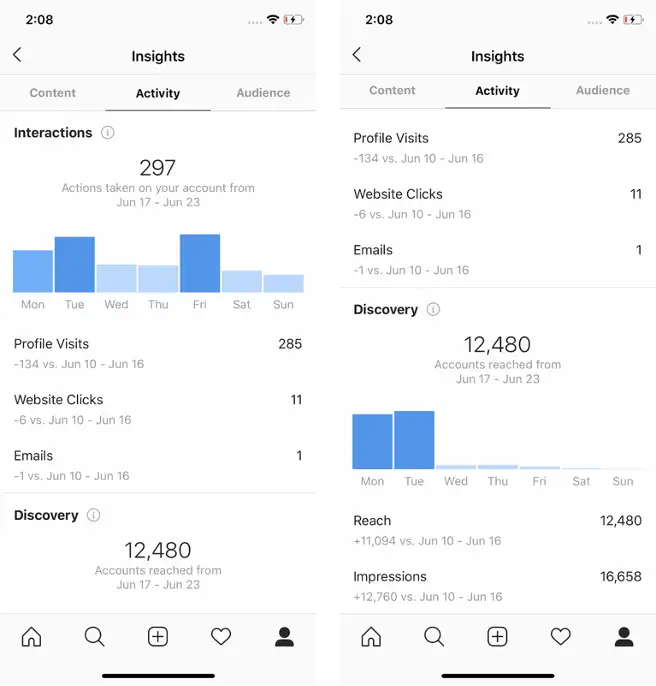
Your Instagram profile is packed with data waiting to be explored. Instagram Insights provides actionable details about your audience, including demographics, engagement patterns, and content performance.
Dive into this goldmine to identify your top-performing content and understand your followers better.
For instance, if your stats show high engagement from young urbanites who love fashion, lean into trends like OOTD (Outfit of the Day) or GRWM (Get Ready With Me).
Tailoring content to your audience’s interests can help you deepen connections and spark more interactions.
Listen to Your Audience
Beyond the numbers, social conversations can offer valuable insights into your brand’s perception. Monitor comments, direct messages, and hashtags to see what your audience is saying.
Are they praising your latest campaign or asking for improvements? Use this feedback to shape future content or even refine your products.
Test, Learn, and Adapt
Statistics are not just numbers; they’re signals. Use them to experiment. Test posting times, formats, or trends based on the data and see what resonates best. For example, try incorporating shorter Stories or narrative-driven Reels to capitalize on the latest engagement trends.
Instagram stats are a powerful compass. By understanding and acting on them, you can keep your strategy fresh, your audience engaged, and your brand thriving on this ever-evolving platform.
Final Note
As we step into 2025, paying close attention to Instagram statistics has never been more important. These numbers aren’t just figures; they’re insights into user behavior, platform trends, and opportunities for your brand to thrive.
From understanding your audience better to optimizing your content strategy, these stats are the roadmap to better engagement, increased followers, and ultimately, business success.
The data we’ve shared in this post isn’t meant to sit idle. Use it to refine your strategy, try out new content formats, and explore untapped potential on Instagram. The platform is evolving, and with the right strategy, your brand can lead the way.
FAQs
How effective is Instagram for marketing?
Instagram is highly effective for marketing, boasting over 2 billion monthly active users. It offers a visual and engaging platform for brands to connect with their audience.
With 70% of shoppers turning to Instagram for purchase inspiration and 62.7% of users researching brands and products, it’s a key player in driving awareness, engagement, and sales.
How often should marketers review Instagram statistics?
Marketers should review Instagram statistics regularly – ideally, on a monthly basis.
Frequent reviews help track campaign performance, spot emerging trends, and adapt strategies promptly.
For example, analyzing Instagram Insights monthly can reveal which content formats resonate most, enabling marketers to optimize their posting schedules and content types for maximum impact.
What is the best time to post on Instagram? Can Instagram statistics help determine this?
The best time to post on Instagram varies by audience and industry, but research suggests that weekdays between 10 AM and 12 PM are generally effective.
Instagram statistics, especially insights from the platform’s analytics, can provide precise data about when your specific audience is most active. This ensures your posts reach the right people at the right time.
How do Instagram Reels statistics differ from regular post statistics?
Instagram Reels statistics often focus on metrics like views, plays, shares, and saves, highlighting the content’s virality. Regular post statistics, on the other hand, emphasize likes, comments, and reach.
While Reels are more geared toward increasing visibility and attracting new followers, regular posts tend to foster deeper engagement with your existing audience.
In what ways do Instagram statistics help identify potential influencer partnerships?
Instagram statistics provide insights into audience demographics, engagement rates, and content performance, which are essential for identifying suitable influencers.
By analyzing metrics like follower demographics, average engagement rates, and content reach, marketers can find influencers whose audience aligns with their brand’s target market.
This ensures that partnerships are both authentic and effective in driving results.
How do you view insights on Instagram Stories?
To check the insights for your Instagram Stories, follow these steps:
- Open the Instagram app and navigate to your profile.
- Tap on your profile picture in the top-left corner to access your active story.
- Swipe up from the bottom of the screen while viewing your story to reveal its insights.
- Check the number of views, impressions, and reach for your story. You can also see interactions like taps forward, taps back, replies, and shares.
- If you have multiple stories, swipe left or right to view insights for each one.
These insights help you understand how your audience interacts with your Stories, allowing you to optimize future content for better engagement.

