Facebook Analytics: A Beginner’s Guide to Facebook Insights
You already know how important your Facebook Insights are to improving your marketing. They show you how your posts and ads perform. With these numbers, you can spend your ad budget wisely, reach more people, and report clear results to stakeholders.
But in 2021, Facebook stopped its old analytics tools. So, how do you get your insights now? In this guide, we will walk you through the new way to measure your Facebook success.
Note: You need a Facebook Business Page or a professional mode profile to access these insights. Personal accounts do not offer detailed analytics.
Table of Contents
What is Facebook Analytics?
Facebook Analytics is a tool that shows you data about your Facebook page. It helps you see how your posts and ads perform.
Although the old Facebook Analytics tool ended on June 20, 2021, you can still get similar insights through Meta Business Suite and other tools.
This data tells you how your audience behaves. It shows how many people see your posts and how they interact. You can learn about content engagement and page growth.
Regularly checking your Facebook analytics is very important. It helps you understand your audience better. With this knowledge, you can create content that boosts engagement and grows your page.
Why Are Facebook Analytics Data Important?
Increased Engagement
Understanding your metrics is key. When you know which posts get the most responses, you can create more of that content.
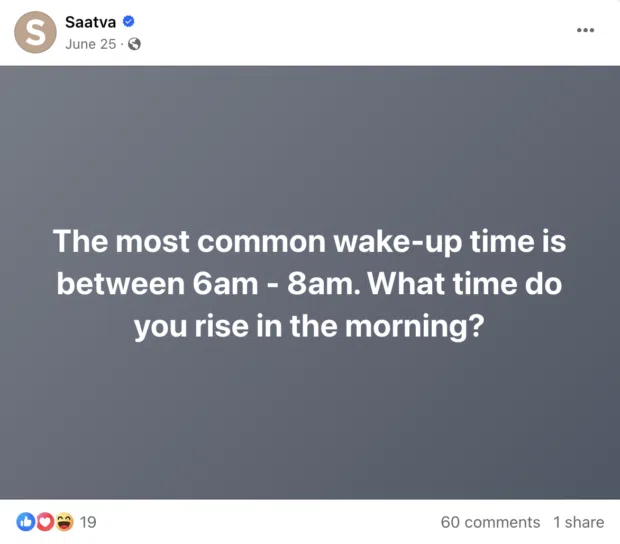
For example, Saatva boosted engagement by asking a simple, clear-cut question in their posts. They said they discovered that this strategy works as it triggers the algorithm to show their posts to more users.
This insight lets you tailor your content strategy, creating posts that resonate with your followers. Better content means even more engagement and steady page growth.
Track Page Performance
You need numbers to know if your page is growing. Facebook analytics gives you the data to measure performance.
By tracking key metrics, you can see what’s working and what isn’t. This helps you adjust your strategy to meet your goals.
Analyze Your Competitors
Competitive analysis is key. You can use Facebook analytics to see what your competitors are doing. Check their post frequency, engagement, and content style.
This is a brilliant way to learn from their successes and mistakes. That way, you can set benchmarks and refine your own strategy.
Foster Community
Facebook is a social platform built on community. Analytics helps you understand your audience’s interests, demographics, and behaviors.
With this knowledge, you can create content that truly resonates. When your audience sees content they love, your community grows stronger.
Robust Reporting
Solid reporting is essential. The best analytics tools let you create and share detailed reports. These reports track your progress and demonstrate your results. With clear data, you can prove the impact of your efforts and guide future strategies.
Facebook Analytics vs Facebook Insights
Before we go deeper into the guide, let’s first address this. You need to know the difference between Facebook analytics and Facebook Insights. So, let’s break it down:
- Facebook Analytics
These are the raw numbers. They show data like likes, comments, shares, and impressions. It’s the hard data behind your page’s performance.
- Facebook Insights
These are the learnings you gain from that data. Insights help you understand what the numbers mean. They show you patterns and trends.
For example, you might use analytics to gather your best-performing posts. Then, you notice that posts with user-generated content get the most engagement. That observation is an insight.
Facebook provides both raw data and basic insights through its native tools. For a deeper look, you might use third-party tools to analyze your performance further.
How to Access Facebook Insights – 3 Ways
You can view your Facebook data in three different ways. First, use your Professional Dashboard if you have a Facebook Business Page. You can check insights via Meta Business Suite. You can also explore Facebook Group Insights if you run a group.
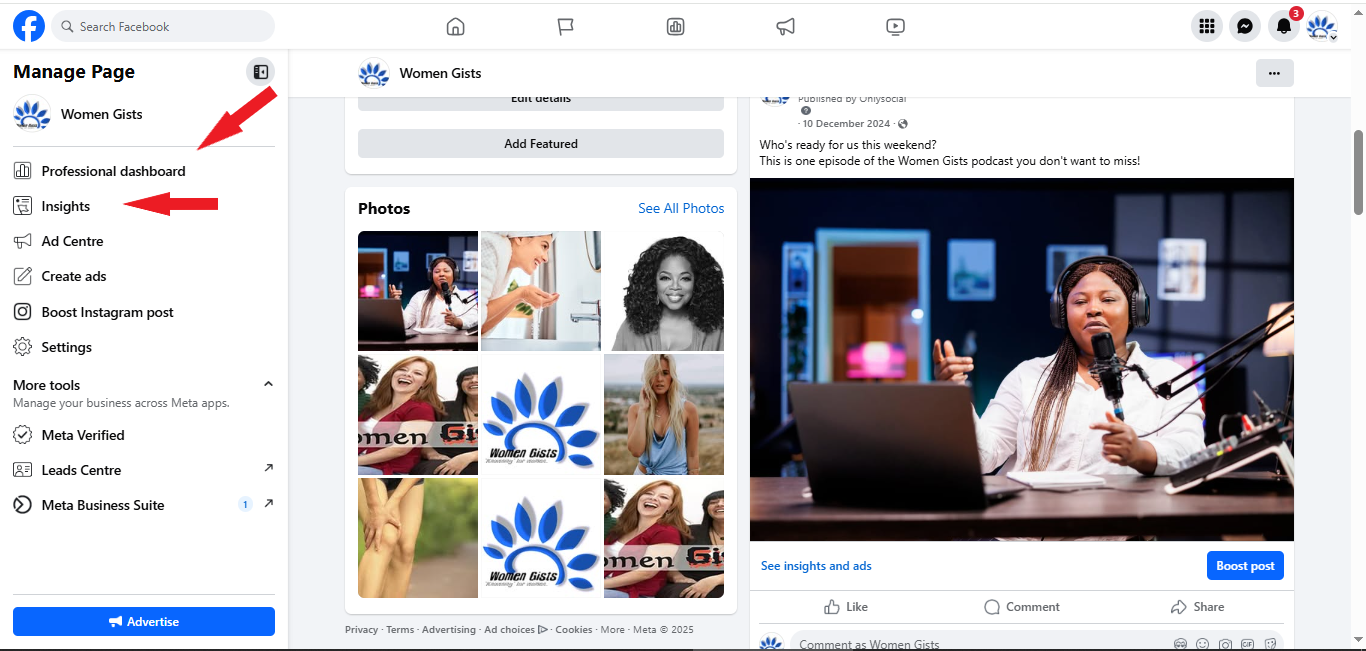
How to Access Insights in the Professional Dashboard
If you have a Facebook Business Page, you can access Insights natively through the Professional Dashboard. Here’s how:
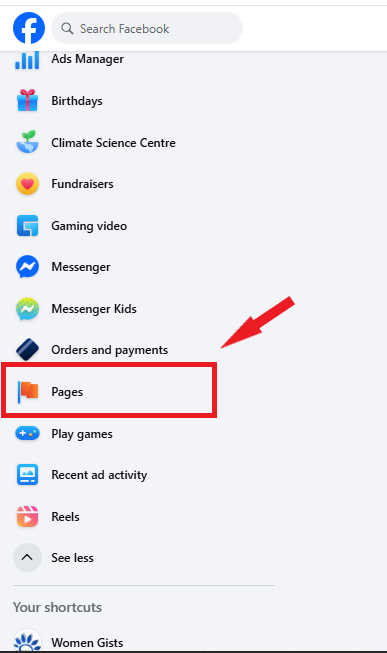
Log In and Choose Your Page:
Log into your account on a desktop. Select “Pages” from the left-hand menu. Choose the Page you want to review.
Open the Professional Dashboard:
From your Page, click on the Professional Dashboard or the Insights tab. The dashboard shows an overview of your page’s performance.
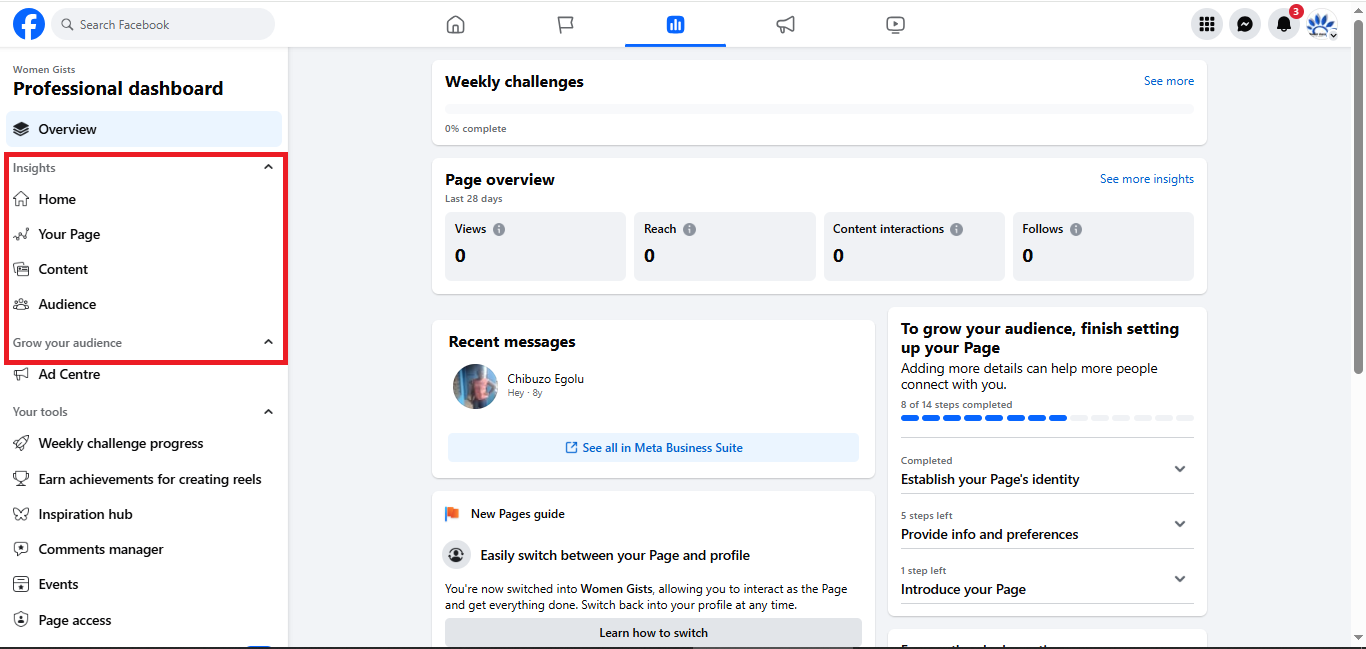
Explore Detailed Metrics:
In the dashboard, use the left-hand menu to navigate to “Your Page,” “Content,” or “Audience.”
- Page Overview: See followers, reach, engagement, new likes, recent content, and messages from the past 28 days.
- Reach and Likes: Check how many people saw your posts and how many new likes you received.
- Actions on Page: Review reactions, comments, shares, photo views, and link clicks by clicking “Your Page.”
- Events: Scroll down to “Events” in the sidebar to see event performance over the last 90 days.
- Videos: Check video performance by navigating to “Content.”
- Follower Insights: Click on the “Audience” tab to view detailed follower information.
How to View Facebook Insights in Meta Business Suite
Facebook Meta Business Suite is now your go-to tool for Facebook analytics. It replaced the old Facebook Analytics tool. When you log in, you will see the “Insights” section on the left menu.
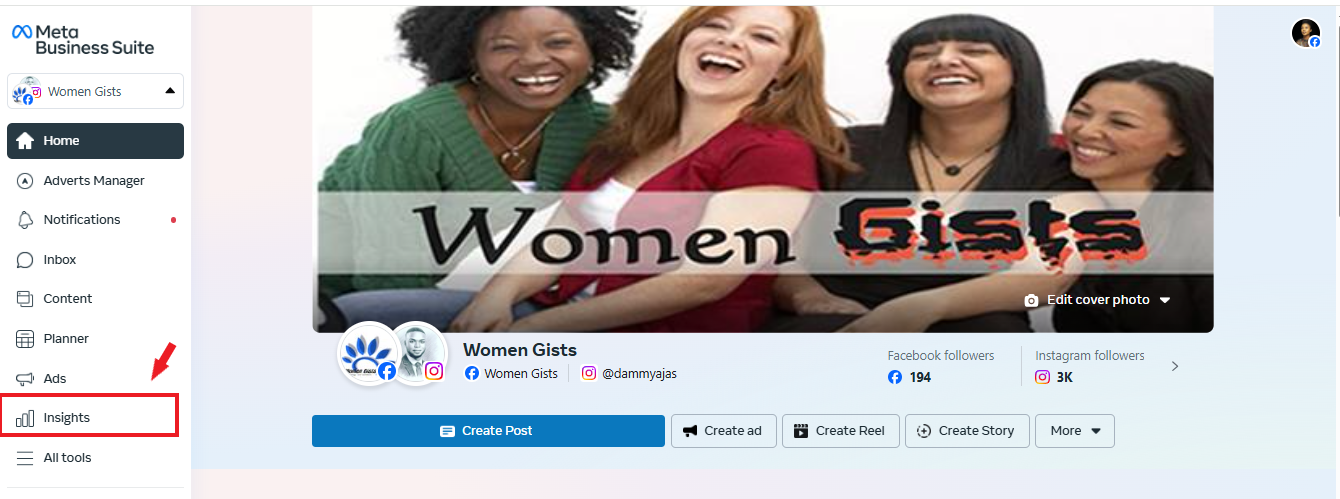
Inside Insights, you find eight tabs that show different data about your page. Here’s a quick breakdown:
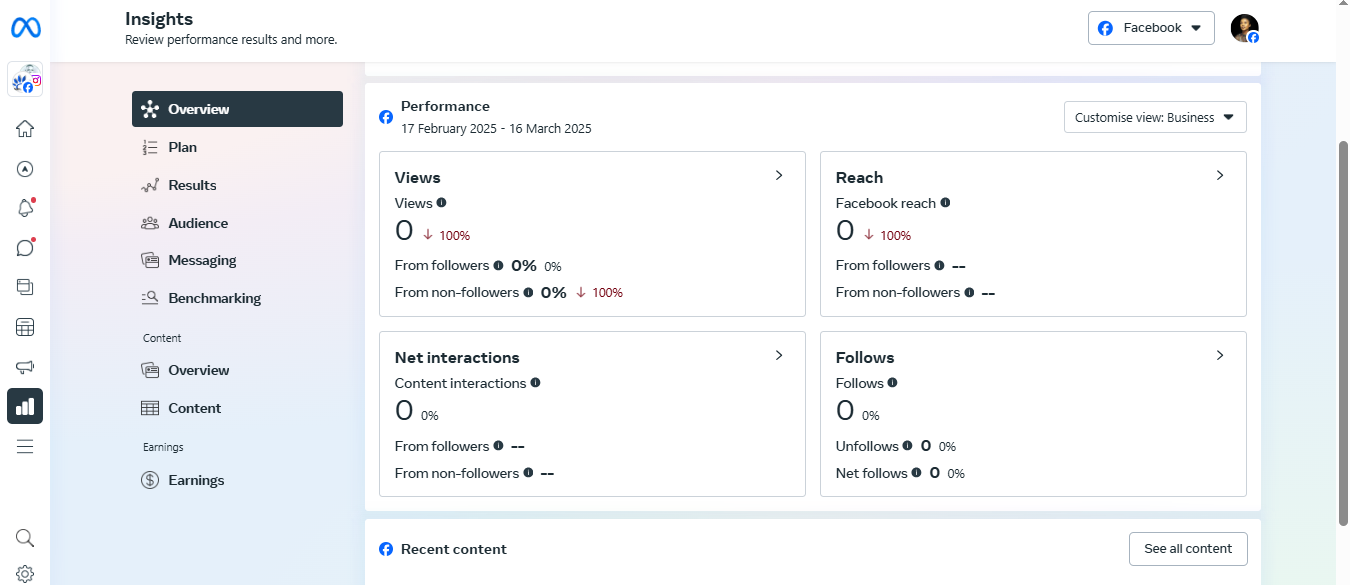
Overview:
The Overview tab gives you a quick snapshot of your page’s performance. It displays daily and cumulative reach, page views, and interactions. This allows you to see trends at a glance and understand how your posts are performing.
Plan:
This tab acts as your guide for setting goals and taking action. Here, Meta offers recommendations and tasks that can help you improve your page. It’s an ideal starting point for new users to learn best practices and plan their next steps.

Results:
In the Results tab, you can explore key performance metrics over your chosen timeframe. This section details your page’s reach, views, new follows, and even ad performance, letting you track your growth and determine if your strategy is working.
You also have the option to export these graphs for reporting purposes.
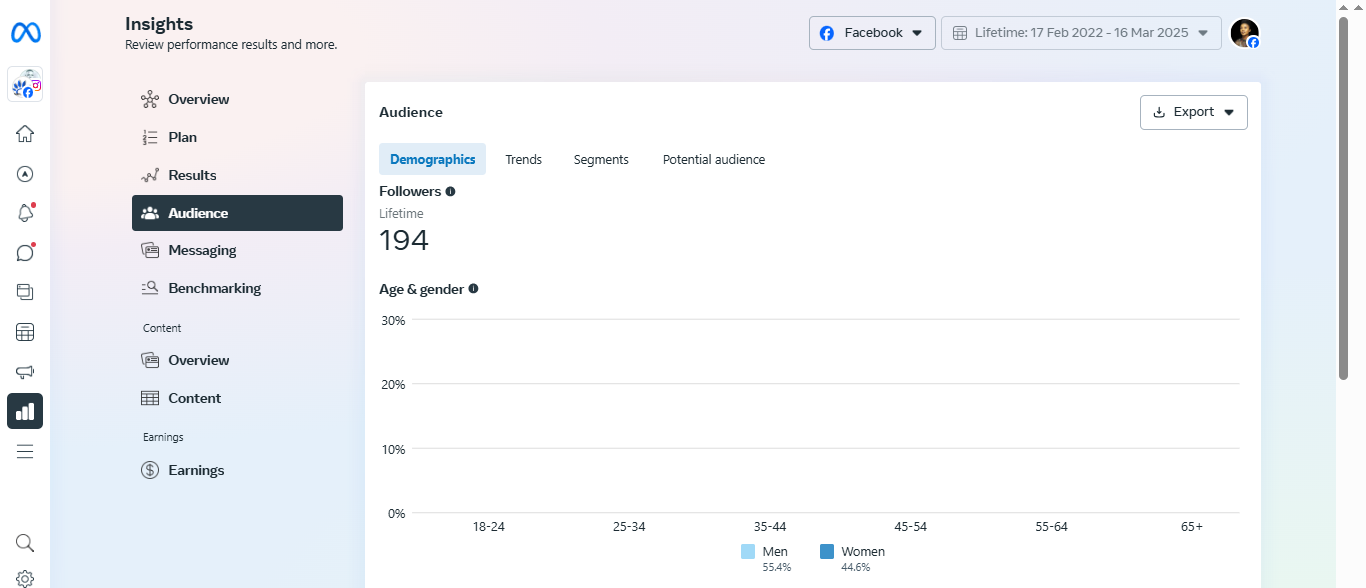
Audience:
This tab dives deep into who your followers are. It includes:
- Trends: Shows changes in follower numbers and activity.
- Segments: Divides your audience by engagement, follows, and messages.
- Demographics: Breaks down age, gender, and location.
- Potential Audience: Helps you see how many more people you could reach.
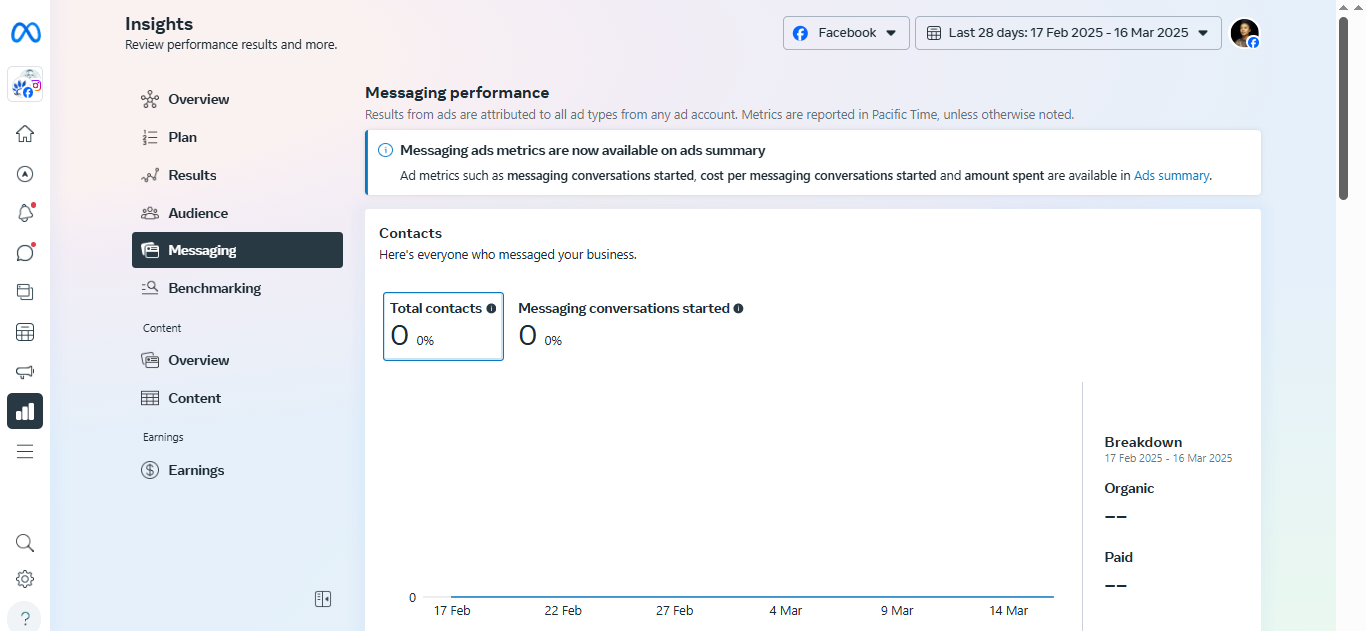
Messaging:
The Messaging tab focuses on your interactions through Facebook Messenger. Here, you can monitor the number of messages sent and received, your response times, and overall communication trends. This is especially useful if you use your Facebook Page for customer service or support.
Benchmarking:
Benchmarking lets you compare your performance with that of similar businesses. It shows metrics like follower count, engagement rates, and posting frequency.
This enables you to see where you stand within your industry and refine your strategy accordingly.
Overview (under Content):
Under the Content section, the Overview tab offers a detailed analysis of how different types of posts are performing.
You can review which formats – whether posts, Stories, or Reels – generate the most engagement, and compare the performance of organic versus paid content to fine-tune your content strategy.
Content:
The Content tab itself allows you to build customized reports and performance charts. You can filter data by post type, media type, or marketing channel
This helps you spot trends and make informed decisions about your future content. This level of customization is key to understanding what works best for your page and optimizing your overall strategy.
Getting Insights from Facebook Groups
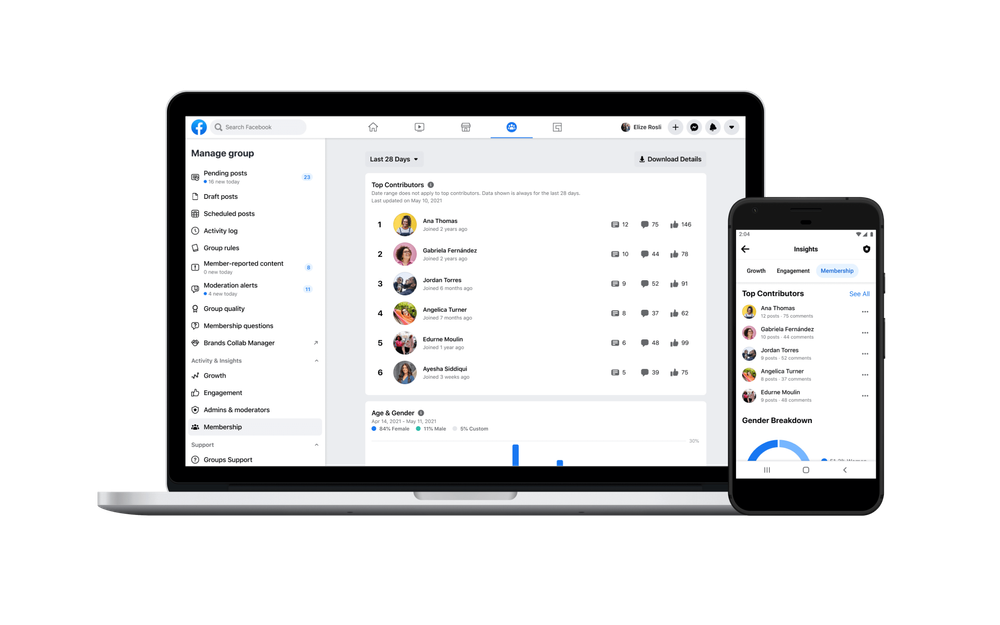
If you are building a community, Facebook groups are a great place to start. They allow you to engage with your members on a personal level. Once you have been active for a while, Facebook provides valuable group insights.
These insights show you detailed information about your group. You can see how individual posts are performing.
They also highlight your top contributors, which can help you explore partnership opportunities or set up a reward system. Additionally, you can learn the best times and days for maximum engagement.
This comes as a lot of help when you are looking to schedule Facebook posts to your group.
To access these insights, simply enter your Facebook group and click on “Insights” in the left-hand menu.
Remember, group insights are only for your Facebook community. What works in your group may not always work on your Facebook page.
Use these insights to shape your posts, interactions, and feedback strategies for your group.
Key Facebook Analytics Metrics to Track
It’s important to know which metrics to focus on to understand your Facebook performance. Let’s break them down into four categories: Engagement, Audience, Performance, and Video metrics.
Engagement Metrics
Engagement metrics tell you how your audience interacts with your content. These include:
- Likes: Show how many people appreciate your posts.
- Shares: Indicate that viewers find your content valuable enough to pass it along to others.
- Comments: Provide direct feedback and start conversations, giving you insights into your audience’s opinions.
- Views: Measure how often your content is seen
- Click-Through Rates (CTR): reveal how many viewers are motivated to take action by clicking on links.
- Mentions: Track how often your brand is referenced by others, offering a sense of your overall online buzz.
Audience Metrics
Audience metrics help you understand who is engaging with your page.
- Demographics: offer a breakdown of your audience by age, gender, and location, so you can tailor your content accordingly.
- Device Information: tells you what kind of devices your audience is using, ensuring your posts are optimized for both mobile and desktop.
- Page Views and Followers: give you a clear picture of the size of your audience and how it is growing over time.
Performance Metrics
Performance metrics focus on the efficiency and cost-effectiveness of your campaigns.
- Cost Per Click (CPC): shows you how much you’re spending on each click, which is vital for budgeting.
- Click-Through Rates (CTR): are revisited here to assess how compelling your ads are.
- Conversion Rate: tells you what percentage of clicks lead to desired actions, like purchases or sign-ups, making it essential for measuring ROI.
- Cost Per Mile (CPM): or cost per 1,000 impressions, helps you understand how cost-effective your ad spend is in reaching a large audience.
Video Metrics
If video is part of your strategy, these metrics are key.
- Average Watch Time: shows how long viewers stick with your video, indicating its ability to hold attention.
- Views: count the number of times your video is played, giving you a baseline measure of its reach.
- Video Completion Rate: tells you the percentage of viewers who watch your video all the way through, which is a strong indicator of engaging content.
- Video Engagement – including likes, comments, and shares – shows how well your video resonates with your audience.
Final Note
Facebook analytics play a key role in shaping your strategy. They give you the numbers and insights you need to grow your page. Use this data to make smarter decisions and boost your engagement.
Now that you have this guide, it’s time to put the information to work. Start tracking your metrics and watch your Facebook performance improve!
FAQs
What does Facebook analytics show?
Facebook analytics shows you key metrics such as reach, page views, likes, shares, comments, and engagement rates. It also provides data on your audience demographics, device usage, and the performance of your ads and posts.
How often should I review my Facebook analytics?
It’s a good idea to check your analytics regularly. Many businesses review them weekly or monthly to track performance trends and adjust their strategies as needed.
How can I track competitor performance using Facebook Analytics?
While Facebook Analytics focuses on your own data, you can use benchmarking tools in Meta Business Suite or third-party tools to compare your metrics with those of similar businesses.
This competitive analysis can give you insights into industry trends and help you refine your strategy.
Which Facebook metrics should small businesses focus on?
Small businesses should focus on metrics like engagement (likes, comments, shares), reach, click-through rates, and conversion rates. Also, keep an eye on audience demographics and page growth to ensure your content resonates with your target market.
Can I track Facebook Page activity from my mobile device?
Yes, you can access Facebook analytics on your mobile device. Tools like Meta Business Suite offer mobile apps that let you monitor your page activity and insights on the go.