A Marketer’s Guide to Video Metrics: Everything You Need to Know in 2025
You love making great videos. But how do you know they’re actually working?
In 2025, nearly every brand is in on video marketing, and that means the space is more crowded than ever. Churning out clips without a clear way to measure success is like tossing messages into a storm and hoping one sticks.
That’s where video metrics come in.
These are the numbers that tell you what’s landing – and what’s not – across various social media platforms.
In this guide, you’ll learn exactly which video metrics matter, how to read them on each platform, and how to turn those insights into your next winning campaign. Just keep reading!
Table of Contents
- 1 What Are Video Metrics and Why Should You Track Them?
- 2 Key Video Metrics to Track
- 3 Additional Video Insights for Video Strategy Evaluation
- 4 How Video Metrics Differ by Platform
- 5 Technical Factors That Influence Your Video’s Performance
- 6 How OnlySocial Can Enhance Your Video Marketing Game On Social Media
- 7 Final Thoughts
- 8 FAQs
What Are Video Metrics and Why Should You Track Them?
Video metrics are the key numbers that show you exactly how your videos are performing online.
They go beyond simple views to reveal what’s really happening to your videos. They offer insights into how long people stick around, which moments they rewind, and how often your clips get shared.
By keeping an eye on these figures, you get a clear roadmap for fine-tuning every video you upload.
Imagine throwing a party and watching which snacks disappear first, when guests start to leave, or which songs get everyone dancing. Video metrics work the same way for your content.
They spotlight the parts your audience loves and flag where interest fades. That means you can craft videos that hold attention and generate the required engagement.
Tracking your top KPIs also doesn’t just let you know your audience’s habits toward your content. It also helps fuel smarter ad spend.
You get to know which clips drive clicks, sign-ups, or sales. Then you can pump budget behind the winners and cut back on what underperforms.
Key Video Metrics to Track
1. View count
Your view count shows how many times your video has been opened. This is your first clue that something about your content caught someone’s eye.
A high view count means your title, thumbnail, or topic is doing its job: sparking curiosity and driving clicks. If you see views rising, you know you’re piquing interest. And if they’re flatlining, it’s time to tweak your hook.
Tips to boost view count:
- Design thumbnails that stand out with bold text or vibrant imagery.
- Experiment with titles that ask questions, promise a benefit, or tease a surprise.
- Share your video across other channels to widen your initial push.
- Post when your audience is most active by checking past performance data.
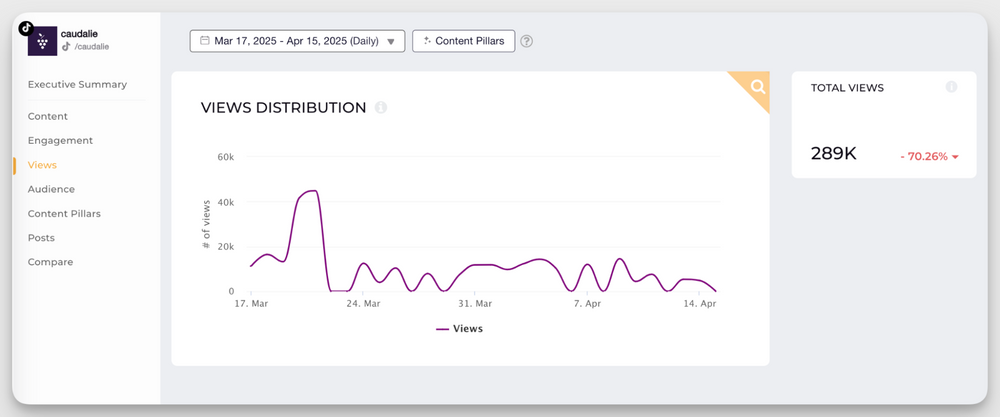
2. Reach and impressions
Reach tells you how many unique people have laid eyes on your video, while impressions count every time it’s been shown, even repeat views.
Tracking both helps you understand if you’re breaking out of your usual circle or simply serving the same viewers again and again.
A healthy gap between impressions and reach means your content is being resurfaced, which is great for brand recall; a small gap suggests you might need to broaden your targeting.
Tips to improve reach & impressions:
- Include a mix of popular and niche hashtags to tap into different audiences.
- Prompt engagement – ask viewers to like, comment, or tag a friend. This helps signal to the algorithm that your post matters.
- Optimize your caption with keywords that match what people search for on each platform.
- Try different video formats to see which the platform favors.
- Collaborate with influencers or partners to tap into fresh follower bases.
3. Retention rate
Retention rate shows what percentage of your video viewers stick around, and at which exact points they drop off. It’s the key to understanding whether your story holds attention from start to finish.
Strong retention means your pacing, visuals, and messaging are all working together. On the other hand, dips or sudden dark patches flag where you need to tighten things up.
Tips to raise retention rate:
- Open with a gripping hook or question in the first 3-5 seconds.
- Keep sentences and transitions snappy. Cut out any filler or long pauses.
- Use text overlays or quick animations to re-engage attention.
- Tease major takeaways early, reminding viewers what’s coming later.
4. Average watch time
Average watch time translates your retention rate into real seconds. It reveals whether your video length aligns with what people actually want to watch.
If viewers bail after 10 seconds on a 60-second clip, you probably need to trim or rearrange content. On the flip side, if they watch every second of a two-minute video, you can confidently go deeper next time.
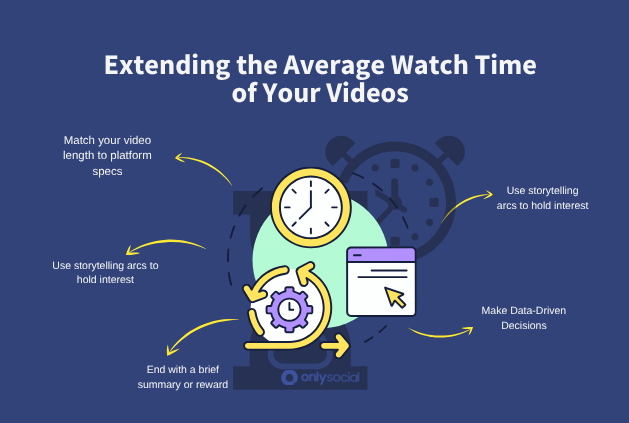
Tips to extend average watch time:
- Match your video length to platform specs.
- Break your content into clear chapters or segments, giving viewers natural pause points.
- Tease key moments to keep curiosity alive.
- Use storytelling arcs to hold interest.
- End with a brief summary or reward so viewers feel the time spent was worthwhile.
5. Completion rate
Completion rate measures the percentage of viewers who watch your video from start to finish. It’s the ultimate badge of “stickiness”.
If people stay until the end, you know your story, pacing, and hook are on point.
A high completion rate means you’re holding attention, while a dip suggests you need to tighten transitions, inject surprises, or deliver value earlier.
Tips to ramp up completion rate:
- Start with an unexpected fact or bold claim to spark instant curiosity.
- Break your video into mini “beats” with clear visual or audio cues so each segment feels fresh.
- Drop quick cliffhangers to keep viewers glued.
- Use subtle motion graphics or jump cuts every 5-10 seconds to reset attention.
- Keep your outro concise – avoid lengthy credits or end screens that let people drift away.
6. Click-through rate (CTR) & engagement
CTR tracks how many viewers click your call-to-action – whether it’s a link in your video, “swipe up” sticker, or end-screen button. And engagement talks about likes, comments, shares, and saves.
Together, they reveal not just if people watch, but if they act.
High CTR and engagement mean your content resonates so strongly that people can’t help but interact, share, or dive deeper into your brand.
Tips to boost CTR & engagement:
- Embed clear, compelling CTAs at natural breakpoints. This could be CTAs like “Tap to learn more,” “Comment your answer,” etc.
- Ask open-ended questions that invite comments or opinions.
- Offer a quick incentive (“Like for a chance to win…”) to spark action.
- Pin a top comment or question to the first spot to foster discussion.
7. Average Percentage View (APV)
APV tells you the share of your video that viewers typically watch. Think of it as the average “slice” of the full pie each person consumes.
If your APV is 70%, you know viewers watch seven out of every ten seconds on average. This metric helps you align your content’s length with real-world attention spans and spot mid-video drop-off zones.
Tips to lift APV:
- Keep your core message front-loaded – deliver key points within the first half.
- Use engaging chapter markers so viewers know what’s coming.
- Experiment with pacing. Mix quick cuts with slightly longer shots to maintain flow.
- Sprinkle in audience-focused questions (“Does this tip work for you?”) to re-capture wandering attention.
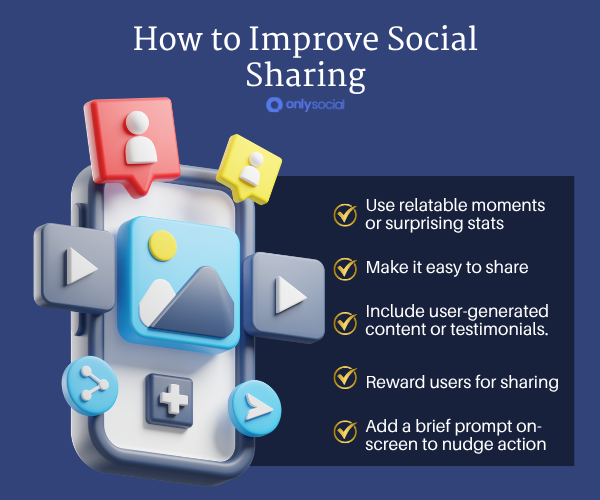
8. Social sharing
When viewers hit “share,” they’re not just passing along a video – they’re putting their stamp of approval on your brand.
Social sharing is the metric that tracks how often your content is reshared across feeds, stories, DMs or external sites.
High share counts mean your message resonates so strongly that people can’t help but spread the word.
Tips to spark more shares:
- Craft relatable moments or surprising stats that viewers want their friends to see.
- Add a brief prompt on-screen to nudge action. An example is something like “Share this with a friend who…”
- Include user-generated content or testimonials. People love sharing themselves and their peers.
- Make it easy: ensure platform-native share buttons are front and center, with minimal friction.
- Tie sharing to community: launch a hashtag campaign or challenge that rewards participation.
9. Conversion rate
Conversion rate measures the percentage of viewers who take your desired next step. This could be clicking a link, signing up, downloading an asset, or making a purchase.
It’s the bottom-line proof of video ROI. A strong conversion rate tells you that your storytelling, CTA placement, and offer are all firing on all cylinders.
Tips to lift your conversion rate:
- Lead with value: open by clearly stating what the viewer gains by taking action.
- Place your CTA at multiple points.
- Use on-screen graphics or buttons to make the next step unmissable.
- Offer an incentive (“Sign up now for 10% off”) to create urgency.
- Align your landing page copy and visuals with the video’s look and tone for a seamless journey.
Additional Video Insights for Video Strategy Evaluation
Best performing content pillars
Your content pillars are the core themes or topics you return to again and again. Think product demos, customer stories, how-to tips, behind-the-scenes peeks, or thought-leadership insights.
Tracking which pillars rack up the most views, engagement, and shares tells you where to double down.
Maybe your audience can’t get enough of case studies, or they love quick hacks that solve a problem in under a minute. When you’re able to identify your top pillars, you’ll know exactly which storylines to invest in for maximum impact.
Tips for identifying and leveraging your best pillars:
- Review performance monthly to spot rising and falling trends.
- Group your videos by theme in your analytics dashboard for easy comparison.
- Replicate the format and style of your top three pillars across new topics.
- Blend high-performing pillars with fresh ideas. For example, a product demo in a fun “day in the life” format.
Traffic sources
Knowing where your viewers come from – whether it’s organic search, social feeds, email blasts, or paid ads lets you funnel more energy into the channels that move the needle.
If 70% of your video plays start from Instagram Stories, it’s a sign to refine your story ads. If direct embeds from your blog drive the most clicks, build stronger video-first blog posts.
Mapping traffic sources helps you uncover hidden opportunities to amplify reach and sharpen your promotion strategy.
Tips for optimizing traffic sources:
- Tag every video link with UTM codes so you can pinpoint exactly where clicks originate.
- A/B test video thumbnails and captions across channels to see which drive the highest click-through.
- Repurpose your video as a teaser clip on other platforms, linking back to the full version.
- Schedule email and newsletter drops around your highest-engagement days and times.
Track these insights alongside your core metrics, and you’ll have a 360° view of what’s working, so you can keep refining and winning with your video strategy.
How Video Metrics Differ by Platform
Every social network has its own way of counting and valuing video performance. Knowing those KPIs will help you tailor your content and measurement so you’re not comparing apples to oranges.
YouTube
On YouTube, views only count after someone watches for around 30 seconds. That means views here are “serious” views. You also get deep stats like total watch time, drop-off points (where people bail), and how often viewers click your cards or end-screen links.
On Instagram, a view pops up after just 3 seconds. You’ll see plays, reach, likes, comments, shares, and saves. For Stories and Reels, note how many taps you get (skips), rewinds, and exits. Reels even tell you the average watch percentage, which is handy for nailing your ideal length.
TikTok
TikTok is all about instant action. A view is counted the moment the video starts. Watch average watch time, total play time (all views added up), completion rate, and engagement (likes, comments, shares). TikTok rewards anything that keeps people watching or makes them hit replay.
Like Instagram, Facebook registers a view after 3 seconds. You’ll see total views, reach, engagement metrics, and average watch time. Facebook also highlights “ThruPlays” – instances where someone watches at least 15 seconds or the whole clip, whichever is shorter, so you know which videos truly grip your audience.
LinkedIn counts a view once someone watches for 2 seconds with at least half the video on screen. Metrics here include impressions, likes, comments, shares, and clicks if you’ve added a link.
Since LinkedIn’s audience is mostly professional, you’ll often see longer watch times on content that educates or inspires action.
Technical Factors That Influence Your Video’s Performance
Great storytelling only goes so far. If your video stutters, looks blurry, or plays poorly on phones, viewers will bail before they see your magic. Here are the key technical elements to nail for smooth sailing:
- Startup speed & buffering
If your video takes too long to load or keeps pausing to buffer, people will click away. So, keep file sizes trim, use platform-friendly formats (like MP4 with H.264), and test playback on different connections to ensure a quick start.
- Mobile-first formatting
Over 75% of social video views happen on smartphones. Shoot or edit with vertical or square framing, use big, clear text overlays, and keep scenes tight. That way, you can ensure your videos will shine even on small screens.
- Audience-aware resolution
Not every viewer needs 4K. On TikTok or Instagram Stories, a crisp 720p might be perfect, and faster to load. But on LinkedIn or YouTube, aim for at least 1080p so your content looks polished for a professional crowd.
- Crystal-clear audio
Even top-tier visuals can’t save muddy sound. Use a decent microphone or lapel mic, and balance your background music so it never drowns out your voice.
Additionally, remember to include captions in your videos for silent autoplay environments. Good audio keeps ears – and eyes – glued to the screen.
How OnlySocial Can Enhance Your Video Marketing Game On Social Media
You’ve got great videos – now let’s make sure they hit the right spots, every time. OnlySocial is built to take the stress out of video marketing and give you back your time.
Here’s how it helps you win:
- Efficient video scheduling
OnlySocial lets you plan your posts days or weeks in advance. Pick your best times to publish, set it once, and relax. The tool will post your videos exactly when your audience is most active.
- Bulk scheduling
Got ten clips ready? You can Upload them all at once, choose your dates, and let OnlySocial queue them up automatically. No more one-by-one hassles.
- Multi-platform management
You can post to YouTube, Instagram, TikTok, Facebook and LinkedIn all at once and from a single dashboard. Write your caption once, tweak it for each network if you like, and publish everywhere with a single click.
- Advanced analytics
See your most important video metrics in one place. The tool allows you to compare performance across platforms, spot trends in seconds, and make data-driven decisions. No more digging through separate apps.
- User-friendly interface
You don’t need to be a tech wizard to use OnlySocial to enhance your content game. It’s clean, simple layout guides you through every task you need to do on the platform, so you spend less time figuring out tools and more time creating.
Final Thoughts
You’ve got the playbook, now it’s time to put it into action.
With the right metrics on your side, you can spot what’s working, tweak what’s not, and build videos that really connect.
Use these KPIs to guide your decisions and watch as each new campaign outperforms the last. You have all you need now. Nothing should stop you from getting the most results from your videos anymore.
FAQs
What is a good completion rate?
A strong completion rate varies by video length and platform, but as a rule of thumb, aim for 70% or higher for short clips – under 60 seconds. But for longer videos (2+ minutes), 50-60% is solid. If you’re hitting those benchmarks, your pacing and hook are keeping people interested.
Which video metrics matter most for ROI?
To judge your bottom line, focus on:
- Conversion rate: Who takes your desired action after watching (sign-ups, purchases, etc.).
- Click-through rate (CTR): How many viewers click your call-to-action link.
- Average watch time: Are people watching long enough to see your offer or message?
- Engagement (likes, comments, shares): Social proof that boosts organic reach and trust.
How do I find metrics on Instagram?
- Open the Instagram app and go to your profile.
- Tap the video post you want to analyze.
- Below the video, tap View Insights.
- You’ll see plays, reach, likes, comments, shares, saves, plus forward taps, replays and exits for Stories or Reels.
Does scheduling affect the reach of my videos?
Yes, but it is positively. Posting at the right times helps your videos hit more feeds when people are scrolling. Consistent scheduling signals the algorithm that you’re an active creator.
It also helps you reach your audience when they’re most likely to watch and engage. All of this have a positive impact on your overall stats, including your reach.